Safeguard Mechanism Reporting FY24: Decarbonisation or Delay?
What are the results and key insights from the first year of the reformed Safeguard Mechanism?
19 June 2025

What are the results and key insights from the first year of the reformed Safeguard Mechanism?
19 June 2025

The first year of the reformed Safeguard Mechanism is complete, and the Clean Energy Regulator has released its inaugural data alongside the Q1 2025 Quarterly Carbon Market report. Together, these provide the clearest picture yet of the latest data in Safeguard Mechanism reporting and how Australia’s major industrial emitters are responding to the updated compliance framework.
The results offer a moment to assess: is the policy delivering on its promise to drive down emissions at scale? Or are further adjustments still needed?
To answer that, it’s important to consider where this reform journey began. When the government launched its consultation on Safeguard Mechanism reforms in August 2022, it was clear-eyed in its critique:
With Labor securing a second term, this cornerstone climate policy remains central to Australia’s decarbonisation agenda. The question now is whether it’s beginning to shift the needle.
There were 219 covered facilities in FY24, with total covered emissions of 135.7 MtCO2e, 2.8 MtCO2e lower than FY23 (see Table 1). This represents a pretty minor reduction; an outcome we generally expected due to the short timeframe corporations had to prepare for year 1 of the scheme.
Most importantly, the reformed baseline setting approach, combined with a 4.9% decline rate for most facilities, achieved its main aim of reducing headroom, that is, the amount a facility’s baseline exceeds its covered emissions. This is our biggest success of year 1, and was the key change required for the Safeguard Mechanism to act similarly to a more traditional cap-and-trade scheme. This shift saw 67% (147 total) of facilities having an exceedance (no headroom) in FY24, compared to only 18% (34 total) of facilities in FY23 (see Fig. 1).
The result?
Most facilities are beginning to face a price on their emissions, and should be actively weighing up how the cost of implementing abatement activities compares to the cost of purchasing Australian Carbon Credit Units (ACCUs) or Safeguard Mechanism Credits (SMCs) to manage their increasing liabilities as their baselines decrease.
| Value | FY23 | FY24 |
|---|---|---|
| Number of covered facilities | 217 | 219 |
| Covered emissions (MtCO2e) | 138.5 | 135.7 |
| Total headroom (MtCO2e) | 31.7 | -0.3 |
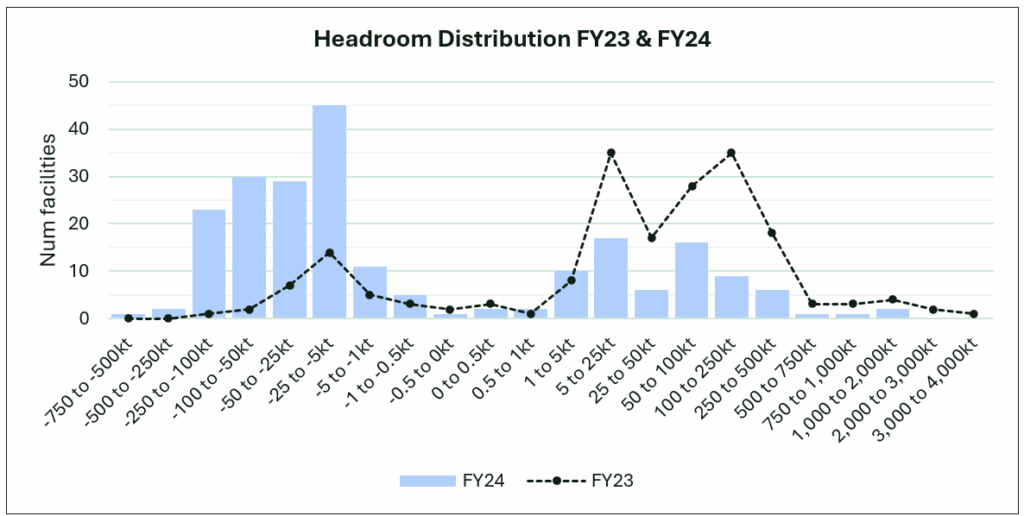
Fig. 1: Distribution of total headroom (baseline – covered emissions) in FY23 and FY24. This data excludes facilities with landfill baselines, and those in FY23 with a multi-year monitoring period.
To manage excess emissions, 1.4 million SMCs and 7.1 million ACCUs were surrendered in FY24, while 8.3 million SMCs were issued to facilities whose covered emissions were below their baseline.
Over 75% of ACCUs surrendered were created under the Human-induced Regeneration, Landfill Gas and Avoided Deforestation methods of the ACCU Scheme (formerly the Emissions Reduction Fund Scheme). Representing generally the cheapest, most criticised ACCUs, this tells us that most Safeguard corporations are not prioritising optics by paying a premium for co-benefits. From FY25, we’ll be watching to see if this is a trend that changes. Perhaps companies like Ausnet and Pilbara Minerals, both of whom purchased Environmental Plantings ACCUs, are giving an insight into the future state of sustainability reporting under the ASRS, where shareholder pressure to invest in carbon offsets perceived to be of higher quality in the market, might become business as usual.

Fig. 2: FY24 ACCU retirement quantity by method category.
The 2025 Q1 Quarterly Carbon Market Report provides some key insights into year 1 compliance management and the future of the carbon market now that demand for credits is increasing. Most importantly, it is estimated that the 2025 ACCU supply will exceed demand by ~14 million ACCUs. Alongside this, ACCU holdings (outside of the cost containment mechanism) are still sitting at around 46 million ACCUs, with over 60% of these being held by Safeguard or Safeguard-related entities.
Given that the combined position of all facilities in FY24 (considering headroom and exceedance) was just 266 ktCO2e of exceedance, there is clearly excess credit supply for at least the near term.
For the Safeguard Mechanism to drive actual decarbonisation, the price of carbon needs to increase such that the cost of reducing emissions is less than the cost of buying the associated amount of carbon credits. Given basic market fundamentals, this will require the imbalance between supply and demand to decrease.
61 facilities generated over 8.2 million SMCs in FY24, but 75% of these were generated by just 12 facilities (see Fig. 3).
Delving into these facilities, this is what we’ve found:
Given the finalisation of the SGM reforms did not allow for a vast amount of preparation time for facilities to implement abatement activities, facilities that were able to reduce their emissions intensity generally either had a project in the pipeline or had options to control emissions through operational management. This may have meant that in year 1, the SGM encouraged oil & gas facilities to reduce venting and better manage the use of flares, simple activities that could have played a material enough difference in their emissions intensities to mitigate the 4.9% decline rate. This is exactly what a cap-and-trade scheme is designed to do – encourage the prioritisation of the implementation of the lowest cost, technologically ready abatement initiatives in the short term, while planning for what comes next as the decline rate exerts downwards pressure on baselines and thus, financial pressure on corporations.

Fig. 3: FY24 SMC Issuance. Responsible emitter labelled for SMC issuance above 200,000 SMCs or 2 MtCO2e.
The aggregate change in covered emissions of Safeguard facilities is going to be the key metric for understanding if the Safeguard Mechanism is a strong enough policy to meet Australia’s planned trajectory to its emissions reduction targets. Yet, the legislation provides us with an unprecedented amount of facility-level data. These are the questions we’ll be looking to answer in early 2026 when the FY25 data is available:
Learn how we helped Orica successfully register one of the largest projects in the ERF’s history.
We are the world’s leading purpose driven, digitally enabled, science-based activator. And always welcome inquiries and partnerships to drive positive change together.


