Safeguard Mechanism FY25: What the Data Reveals

It’s a big year for the reformed Safeguard Mechanism (SGM). The consensus this time last year was that it was reasonable to expect low levels of actual decarbonisation, given that the policy itself was not finalised until well into the first reporting year (FY24). As a result, we assessed ‘success’ by looking for a reduction in headroom that would signify the transition of the policy from one with no real legs, to one that would drive Australia’s heaviest emitters to contribute to our newly minted emissions reduction targets.
In 2026, we are expecting the first review of the policy to commence (however, note there is potential for delays due to the current fuel crisis). Our current read is that the review will be focused on ensuring that the policy is working as intended, and we are anticipating the potential calibration of key components of the scheme (i.e., baseline calculations, flexibility mechanisms and crediting) to ensure it is effectively incentivising on-site abatement.
Covered emissions decreased by a further 3.2 MtCO2e between FY24 and FY25, bringing them down to 132.5 MtCO2e (excluding facilities covered by a landfill baseline, and reporting under s58B). This reduction is best contextualised within the SGM’s goal of having net emissions (covered emissions plus ACCUs issued minus credits surrendered) below 100 MtCO2e in the FY30 reporting year.
While we can’t reasonably expect the reduction trajectory to be linear, a continuing slow trend increasingly shifts the emissions reduction task to future years.
The sectoral breakdown of covered emissions in Figure 1 highlights at first the stark discrepancy in contribution to covered emissions between sectors. The combined covered emissions from the Oil and gas extraction (ANZSIC code 070) and Coal mining (060) sectors exceed those of all other sectors represented by SGM facilities at 73.1 MtCO2e in FY25 (down from 74.01 MtCO2e in FY24).
We’ll dig into these sectors further in this piece, but our key takeaway here is that emissions reduction from fossil fuel extraction must occur if the SGM is going to achieve its FY30 goal.
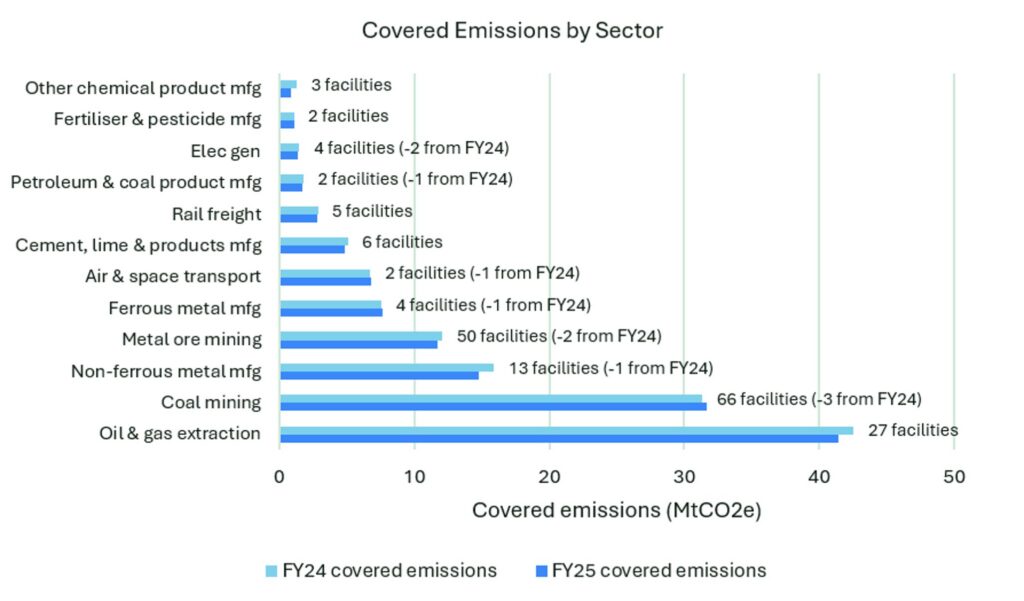
Notably, a 1.1 MtCO2e covered emissions reduction occurred in each of the Oil and gas extraction and Basic non-ferrous metal manufacturing (ANZSIC code 213) sectors from FY24 to FY25.
We’ve interrogated the non-ferrous metal manufacturing facilities in Figure 2 below, which plots the change in each facility’s covered emissions and baseline between the two years. While we don’t have full oversight over each facility’s emissions profile, the design of the production-adjusted baseline enables us to infer whether changes in covered emissions are primarily linked to changes in production levels at the facility. For instance, in the case of Rio Tinto’s Gove. Operations, covered emissions increased by 1% while the facility’s baseline decreased by 5%, suggesting minimal changes in its annual bauxite production amount.
Contrary to this, just three facilities combined to make up over 0.95 MtCO2e of the sector’s covered emissions reduction: Alcoa’s Kwinana Alumina Refinery (-775 ktCO2e) and BHP Nickel West’s Kalgoorlie (-74 ktCO2e) and Kwinana (-109 ktCO2e) facilities. For each of these facilities, their baselines reduced substantially over the same period, suggesting that the reduction in covered emissions was primarily linked to reduced operations, not on-site decarbonisation. This finding is substantiated, with BHP Nickel West announcing the temporary suspension of its operations from 2024 (link), and Alcoa curtailing production at its Kwinana Refinery from June 2024 prior to permanent closure of the site (link).
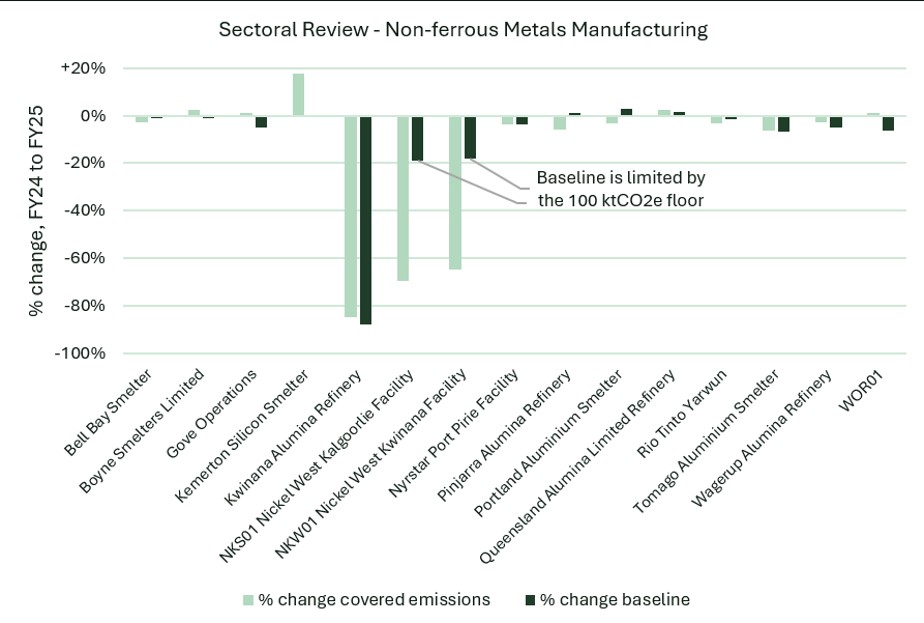
Our takeaway here is that the change in covered emissions is not a suitable metric for assessing the decarbonisation impact of the Safeguard Mechanism on its own.
While complex to calculate, especially in the case of facilities with numerous production variables, an emissions intensity metric is the only way to credibly separate decarbonisation impact from operational changes. Given that emissions intensity determination data has almost complete coverage of historical facilities, this is not unachievable, and would go a long way to improving the transparency of the scheme at the facility and sectoral level.
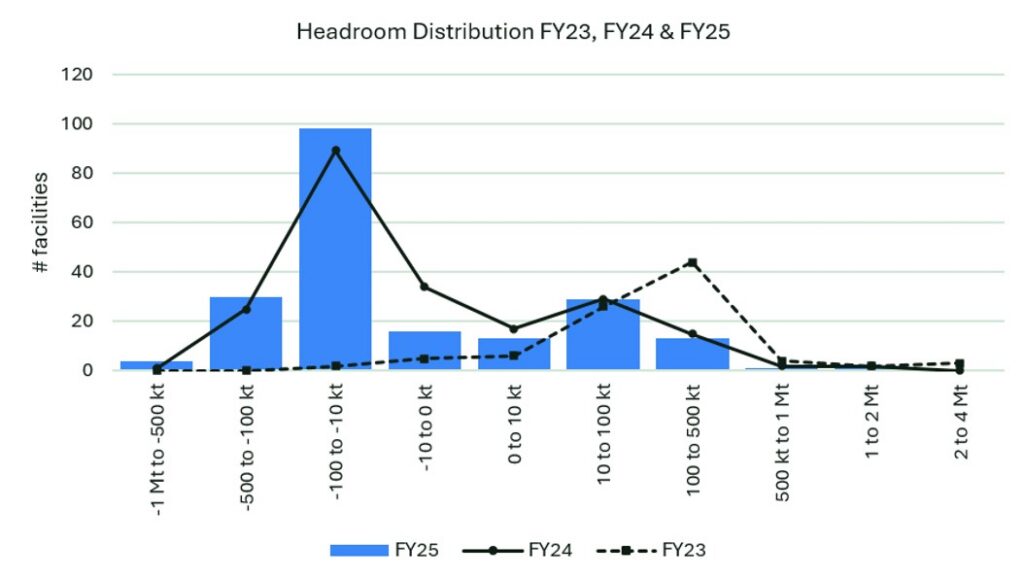
Total headroom, taken as the difference between a facility’s baseline and its covered emissions, has continued to decrease in FY25. We considered the reduction in headroom to be a primary success measure in year 1 of the scheme, as it represented an effective transformation of the baseline calculation approach to apply downwards pressure that the scheme previously failed to achieve.
In FY24, 70% of facilities faced a liability, compared to just 5% in FY23. This figure has increased slightly again to 72% in FY25. More notably, the headroom distribution (plotted in Figure 3) has continued to shift left, meaning more facilities are facing greater liability, and fewer facilities have considerable headroom. This corresponds to SMC issuance, which dropped from 8.3M SMCs across 63 facilities in FY24 to 6.7M across 54 facilities in FY25.
The reduction in headroom itself is a positive trend, but a fairly coarse measure of success, given that headroom can reflect actual decarbonisation (i.e. Orica’s Yarwun Nitrates facility has 202 ktCO2e of headroom in FY25 as a result of on-site decarbonisation of its nitric acid production. Therefore, in this instance, headroom is not reflective of the SGM baselines being insufficiently tight.
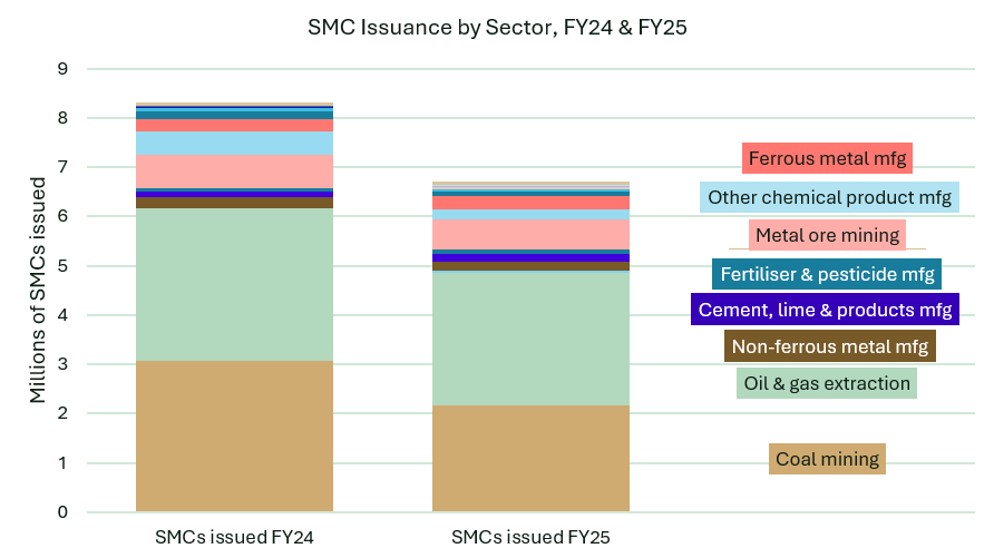
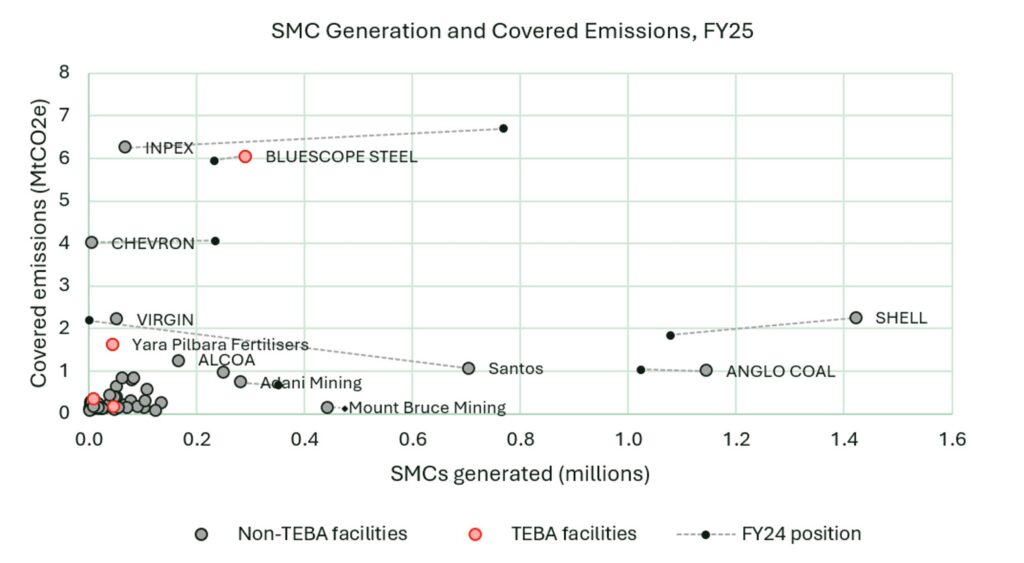
One key area of interest for us leading into the 2026-27 review is equity, both across and within sectors. Here, we’re applying two viewpoints: Figure 4 maps the total SMC issuance in FY24 and FY25 by sector, and Figure 5 disaggregates this into the facility breakdown in FY25, plotted against covered emissions.
Here, we see that fossil fuel extraction facilities are continuing to dominate SMC generation in FY25, with almost 4.9M SMCs generated by the oil and gas extraction and coal mining sectors at 73% of total generation.
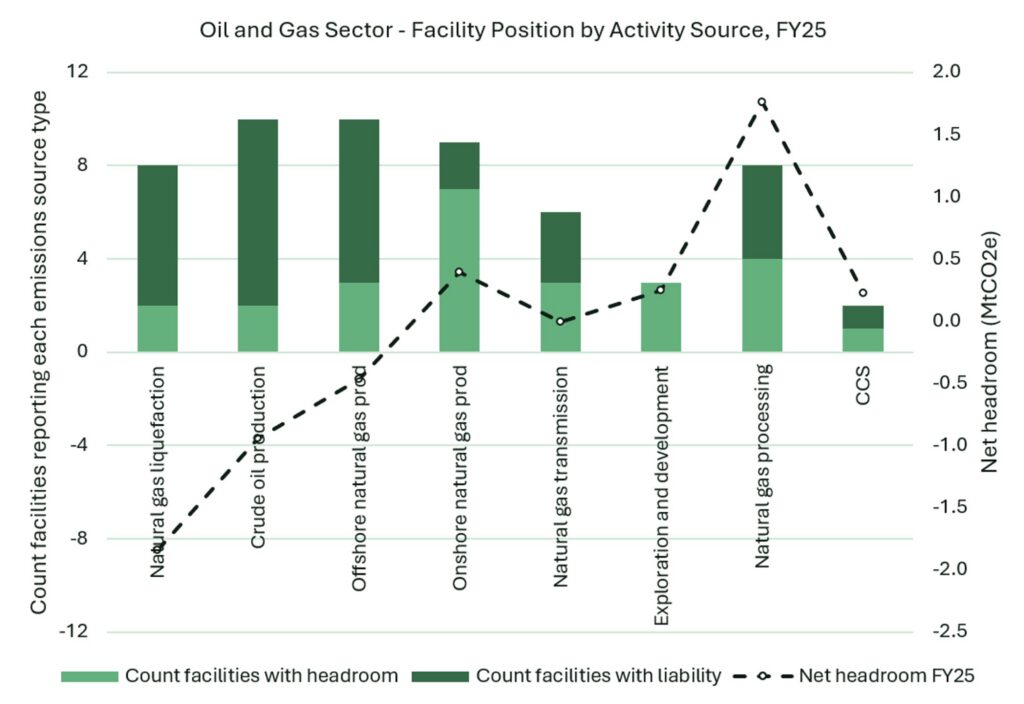
The oil and gas extraction sector is particularly noteworthy, with almost 50% of covered facilities in the sector having headroom in FY25, a reduction of just one facility from FY24. Coal mining facilities are comparably weighted more heavily to face liability, with 15 of the 66 coal mining facilities having headroom in FY25, down from 20 in FY24 (excluding facilities reporting under s58B). This leads to the combined position of the coal mining sector being one of net liability (equal to 4.9 MtCO2e), while the oil and gas extraction sector has a net headroom of 0.1 MtCO2e.
At the facility level, we see facilities with a disproportionately large SMC issuance, and the distribution is becoming more unequal. In FY24, the ten facilities with the greatest SMC issuance accounted for 69% of all SMCs issued. In FY25, this increased to 74%.
1.4M SMCs were generated by Shell’s FLNG facility and 1.1M by Anglo’s Capcoal Coal Mine, both at an increase from FY24. However, three of the other top 10 facilities in FY25 generated no SMCs in FY24, being Santos’ Moomba Plant (oil and gas), Hail Creek’s coal mine (coal), and Orica’s Yarwun Nitrates (chemicals). All three facilities experienced a substantial drop in covered emissions between FY24 and FY25, equal to 51%, 28% and 79%, respectively.
In each case, the reduction in covered emissions was substantial compared to the change in each facility’s baseline, suggesting a reduction in emissions intensity corresponding to the implementation of an on-site abatement activity.
We’ve pulled out our key findings from these figures and dug into some of the background detail.
The facility reports fugitive emissions from three sources: offshore natural gas production, produced water and natural gas processing, each of which is estimated using Method 1 under the NGER Scheme. This estimation approach limits the ability to capture emissions savings from efficiency improvements and component upgrades in its fugitive emissions calculations, as the dominant variables in the calculations for emissions are linked to production-based metrics, such as the number of offshore platforms in operation and the total quantity of natural gas processed. As such, the emissions intensity of oil and gas facilities reporting using Method 1 is highly subject to the composition of methane in the raw gas feed it extracts.[1]
This highlights a unique sectoral inconsistency in the Safeguard Mechanism.
The covered emissions of fossil fuel extraction facilities are highly dependent on the composition of the resource, a dependence that is not reflected in manufacturing activities to the same extent. For coal mines, this is the methane concentration of gas entrained in the seam, and for oil and gas facilities, the proportion of methane in their gas. Should a fossil fuel extraction facility have been operating in a high methane environment in the period used to calculate their site-specific emissions intensity (FY18 – 22), we would expect them to have more headroom available compared to those facilities in lower methane environments.
The SMC issuance impact of this inconsistency is likely to be seen most clearly in the first four years of the SGM when the site-specific emissions intensity values dominate the baseline calculation, reducing with the shift to the default emissions intensity over time.
Regardless, should the price signal be high enough, this configuration should incentivise the extraction of the lowest emissions-intensive fossil fuel resources.
[1] A reduction in flaring or venting emissions during either gas production or processing could also contribute to the reduction in methane emissions. Greater granularity of data is required to know the true source of the reduction, so we focus on emissions other than those from venting and flaring here, justified on a sectoral materiality basis.
In DCCEEW’s Safeguard Reforms Factsheet published in May 2024, they stated that the policy was designed to require “covered facilities to deliver a proportional share of Australia’s 2030 climate target”. What we are seeing in the first two years of the scheme is a rather poor alignment with this goal, with facilities continuing to be highly reliant on ACCUs generated externally to the scheme to manage their liability.
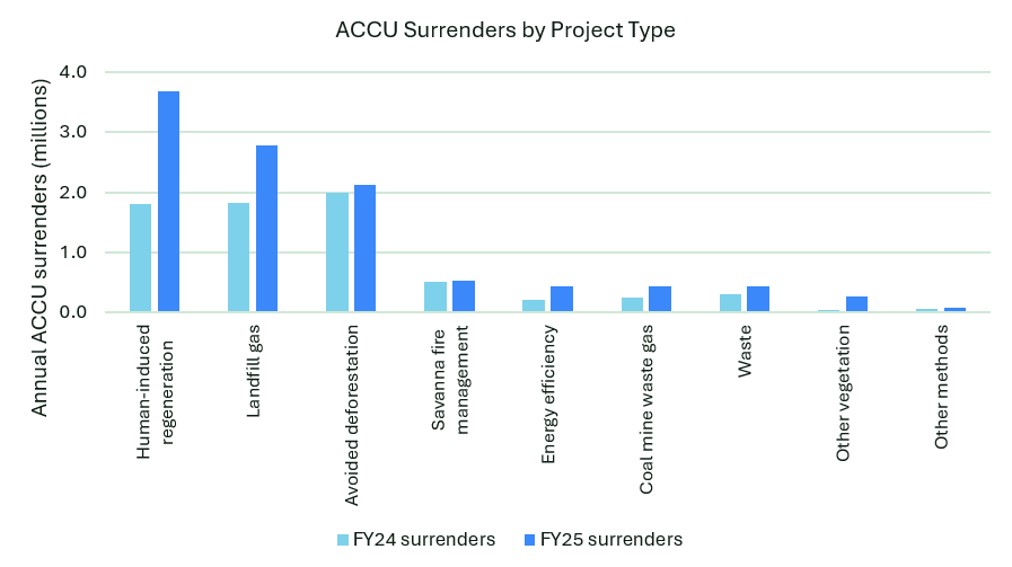
In FY25, the total ACCU surrenders to manage emissions exceedances increased to 10.8M ACCUs, up from 7.4M in FY24.[1] The human-induced regeneration (HIR), landfill gas and avoided deforestation methods continued to dominate ACCU supply in FY25, however there was outsized growth in the surrender of HIR ACCUs, which were used to manage over 3.5 MtCO2e of emissions exceedance in FY25 (Figure 7).
A positive in the ACCU data is that the purchase and surrender of ACCUs from Methods that more often attract co-benefit price premiums has continued in FY25, although not materially improved. Over 500,000 Savanna Fire Management ACCUs were surrendered in FY25, alongside 15,000 Environmental Plantings ACCUs. 54,000 of these were surrendered by Melbourne Water, Talison Lithium and AusNet Services, where ACCUs from these project types comprised 100% of their total ACCU surrender in both FY24 and FY25.
We flagged this as an area of interest last year, as we were looking to see if Mandatory Climate-Related Financial Disclosure requirements under the Australian Sustainability Reporting Standards (ASRS) would lead to increased scrutiny on ACCU Methods, and therefore encourage entities to pay a premium for ACCUs with co-benefits. By this time next year, we will have a full year of AASB S2-compliant reports to assess and compare, and will be in a better position to make a call on any possible trends.
[1] Note, this figure includes ACCUs surrendered under a deemed surrender arrangement through an existing Carbon Abatement Contract, but excludes ACCUs surrendered by facilities with a landfill baseline.
The volume-weighted average ACCU spot price did not exceed $40 / ACCU in the compliance period (Quarterly Carbon Market Report, March 2026).
In our experience, this cost signal continues to be insufficiently high to promote on-site abatement, particularly given the large-scale, high complexity decarbonisation pathways for heavy industry.
In FY25, we’ve seen a continued impact of this in the preferential surrender of ACCUs over SMCs. Because there are no limits on the vintage or source methods of ACCUs, this means that the Safeguard Mechanism is largely succeeding at financing existing abatement outside of the industrial sector at present.
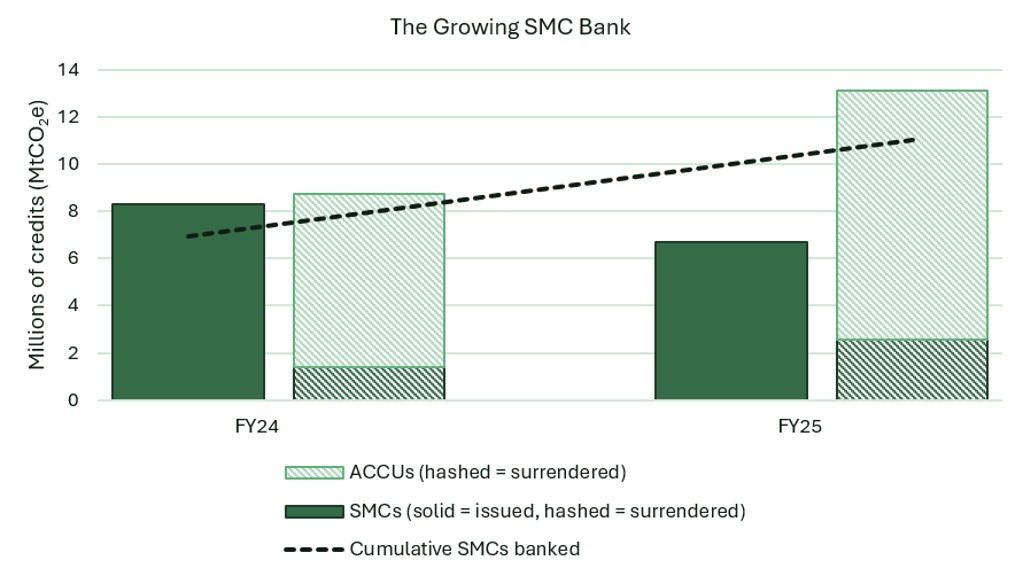
An additional challenge for the 2026-27 policy review is the growing SMC bank, which reached over 10 million credits in FY25 (Figure 8). This forms a significant and material risk to the actual decarbonisation potential of the scheme to at least FY30, as the SMC bank forms a guaranteed credit supply to Safeguard entities prior to their expiration, which is currently legislated as the end of the FY30 compliance year.
Should the bankability of SMCs extend to FY50, significant uncertainties arise in predicting their likely use case, dependent largely on the rate of ACCU generation outside of the SGM alongside other demand drivers, such as the future of the government’s Climate Active scheme, and Article 6 of the Paris Agreement.
This continues to point to the challenge of optimising the Safeguard Mechanism to rebalance the supply and demand ratio for carbon credits such that the price signal is high enough to favour on-site abatement activities, while ensuring adequate protection for the manufacturing and non-fossil fuel resource extraction sectors, which have largely not benefited from SMC issuance in the first two years of the scheme.
The first review of the reformed Safeguard Mechanism is well timed. Two years of data are now available, providing a basis to assess how the scheme is operating in practice and whether it is delivering against the outcomes set out during the design of the reforms.
As a key pillar of the Australian Government’s climate policy, the Safeguard Mechanism must drive genuine emissions abatement if legislated reduction targets are to be met. We see it as a high priority to achieve emissions intensity improvements across core manufacturing outputs, rather than relying on absolute emissions reductions resulting from facility closures.
The treatment of fossil fuel extraction facilities and the role of carbon credits are two areas we are watching closely ahead of the review. Effective incentives for on‑site abatement and equitable treatment across sectors are critical to the scheme’s integrity and long‑term success. The data to date suggests that targeted adjustments may be required to better deliver on these objectives.
Our team of experts have supported many of Australia’s largest emitters with audit, strategic advisory, ACCU procurement and groundbreaking decarbonisation activities under the Safeguard Mechanism. They have an in-depth knowledge of the Safeguard Mechanism Act and can help you navigate the Safeguard legislation and explore opportunities that exist to not only comply but to drive innovation and abatement at scale.
Learn about how we helped Orica bring to life one of the largest abatement projects in Australian History, and reach out to us if you need advice.
We are the world’s leading purpose driven, digitally enabled, science-based activator. And always welcome inquiries and partnerships to drive positive change together.